


21 Reporting
Note: T.O.V.A. results should be interpreted only by qualified professionals.
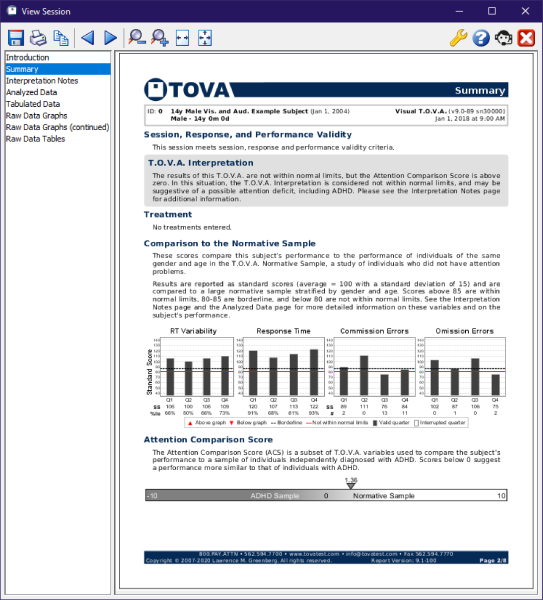
Viewing a report is easy. In the main window, highlight the session you want to report on and choose ‘View’.
Note: If you want to view a comparison report, highlight more than one session using Shift-click or Ctrl-click. The ‘View’ button becomes a ‘Compare’ button, and when you choose it, you will see a graph comparing the highlighted sessions. For more information on the comparison report, see section 21.2.
The T.O.V.A. Report
While you’re viewing a report, you have other options:
-
Save
- - Exports a .pdf file of the report
- Print
- - Send the report to your printer
- Back/Next
- - Proceed through the pages of the report
- Smaller/Larger
- - Zoom out/in on the report pages
- Fit to width
- - Zooms the report page to the width of the window
- Fit page
- - Zooms to view the entire page of the report in the window without scrolling
- Customize
- - Choose which pages of the report to display, among other customizations. See Customizing the Report, section 21.1 below.
- Help
- - Loads this Help section
- Close report
- - Closes the report window.
On the left of the report window is a list of the pages of the report. Highlight a page to view it in the right pane.
21.1 Customizing the Report
Select pages and fields to include
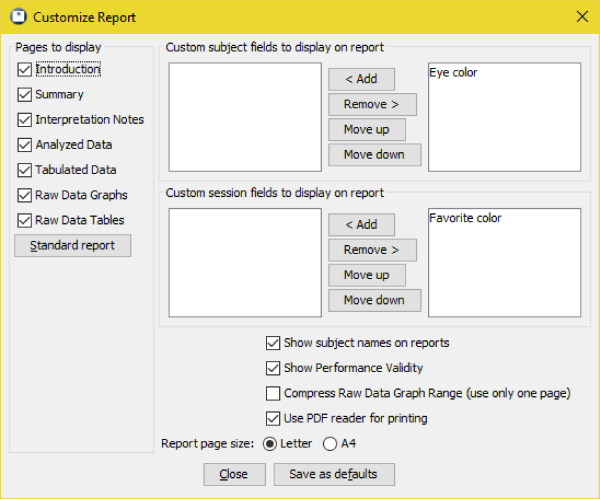
Choose ‘Customize’ from the Report window, and you’ll find several ways to customize the T.O.V.A. report:
-
Pages to display - Select pages to include in your report. You can select pages individually, or you can choose a ‘Standard report’,
which automatically selects all of the pages in the report.
- Custom fields - Choose which custom subject and session fields should appear. When selected, custom fields will appear near the top on most pages of the report.
Note: By default, new custom fields do not appear in the T.O.V.A. report until they are selected, and even then, the field will only appear if it has a value. In other words, if you set no value for Sarah’s hair length, that session’s report will not display “Hair length: ”, it will just not appear.
- Show subject names on reports - If unchecked, this simply causes the subject’s name to not appear on the report when viewed, printed, or saved to a .pdf.
- Show Performance Validity - Uncheck this option to hide Performance Validity.
- Compress Raw Data Graph Range - Raw Data Graphs was expanded in T.O.V.A. 8.2 to two pages in order to show the full range. Select this option to compress the graphs to fit on a single page, as in previous T.O.V.A. versions.
- Use PDF reader for printing - Some printers conflict with our default approach to printing the T.O.V.A. report, causing the report to print very slowly or incompletely. When selected, this works around the problem by exporting the T.O.V.A. report to a PDF and printing the report through your installed PDF viewer. You will need PDF reader software installed to use this feature, but most options will work.
- Report page size - Choose between ‘Letter’ and ‘A4’.
Once you’ve made your changes, choose ‘Apply’, or choose ‘Set as default’ to apply your changes to this and all future reports. Close the window to abandon your selections.
21.2 Comparison Graphs
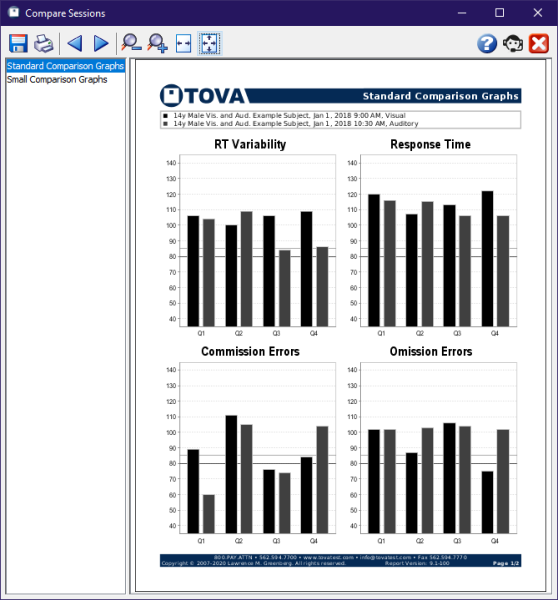
When you select more than one session in the main window, the ‘View’ button becomes a ‘Compare’ button. Click it to bring up a report with graphs comparing statistics of the selected sessions.
You can highlight multiple sessions using ‘Ctrl’-click (Mac users, ‘Command’-click) to highlight each additional session, or ‘Shift’-click to highlight a range of sessions.
The Comparison Report
There are two pages:
-
Standard Comparison Graphs
- - Similar to those in the T.O.V.A. 7, this displays four graphs, each comparing the results for one statistic each session and quarter.
- Small Comparison Graphs
- - This contains many smaller graphs, one for each session and statistic, so that you can compare graphs rather than values.
21.3 Printing problems
We try to support all printers, but if you encounter problems printing the T.O.V.A. report, there is a workaround:
21.3.1 Windows
-
In the Report window, click ‘Save’ and save the .pdf file to a known location (such as your desktop).
- Open that location and right-click the .pdf file.
- Choose ‘Print’. Alternatively, you may choose to open the file in your system’s PDF viewer and customize the printing options there.
21.3.2 Mac
-
In the Report window, click ‘Save’ and save the .pdf file to a known location (such as your desktop).
- Open that location and double-click the .pdf file. That should Preview the saved report.
- In Preview, print the report.
We hope that this works for you. However, please do send us a Tech Support request (section 29) to let us know about the problem, so we can correct this for you and other users.
After that, you can automate this workaround:
-
Run the T.O.V.A. and choose ‘Preferences’, ‘Reports’.
- Check ‘Use PDF reader for printing’ and click ‘Save’.
From then on, printing a report will save a temporary file, open your default PDF viewer, and print the report using your default printer/settings.