


Note: T.O.V.A. results should be interpreted only by qualified professionals.
Viewing a report is easy. In the main window, highlight the session you want to report on and choose ‘View’.
Note: If you want to view a comparison report, highlight more than one session using Shift-click or Ctrl-click. The ‘View’ button becomes a ‘Compare’ button, and when you choose it, you will see a graph comparing the highlighted sessions. For more information on the comparison report, see section 21.2.
While you’re viewing a report, there will be a list of the report pages in the left pane. Highlight a page to view it in the right pane. There are other options along the top of the window (Figure 32).
Button Function Details 
Save Exports a .pdf file of the report 
Send the report to your printer 
Copy... Copy the text of the current report page or the entire report to your clipboard 

Back/Next Proceed through the pages of the report 

Smaller/Larger Zoom out/in on the report pages 
Fit to width Zooms the report page to the width of the window 
Fit page Zooms to view the entire page of the report in the window without scrolling 
Customize Choose which pages of the report to display, among other customizations. See Customizing the Report, section 21.1 below. 
Help Loads this Help section 
Close report Closes the report window
Figure 32: Report Viewer options
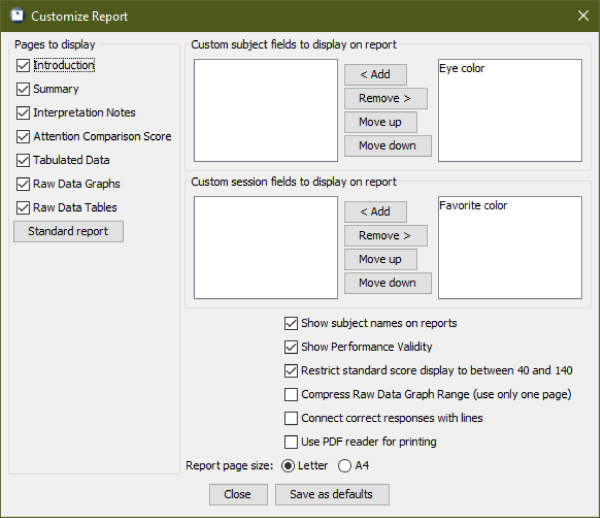
Choose ‘Customize’ from the Report window, and you’ll find several ways to customize the T.O.V.A. report:
Note: By default, new custom fields do not appear in the T.O.V.A. report until they are selected, and even then, the field will only appear if it has a value. In other words, if you set no value for Sarah’s hair length, that session’s report will not display “Hair length: ”, it will just not appear.
Once you’ve made your changes, choose ‘Apply’, or choose ‘Set as default’ to apply your changes to this and all future reports. Close the window to abandon your selections.
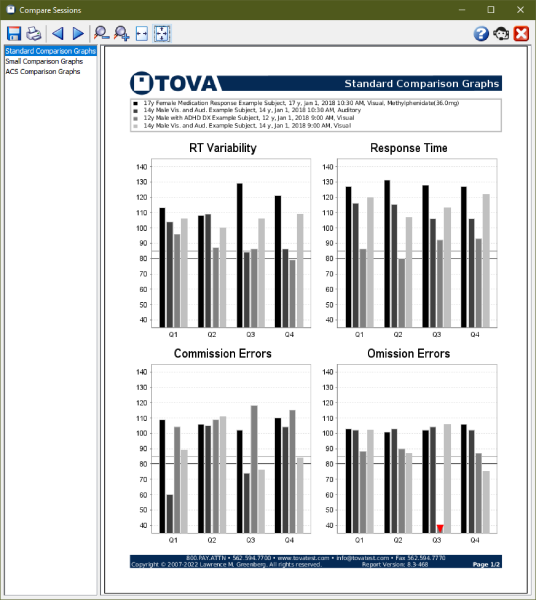
When you select more than one session in the main window, the ‘View’ button becomes a ‘Compare’ button. Click it to bring up a report with graphs comparing statistics of the selected sessions.
You can highlight multiple sessions using ‘Ctrl’-click (Mac users, ‘Command’-click) to highlight each additional session, or ‘Shift’-click to highlight a range of sessions.
There are three pages:
When you are viewing the T.O.V.A. report, you can click the ‘C[o]py the text of this page or the entire report to the clipboard’ button to copy the text of the current page or of the entire report to your OS’s clipboard. You can also right-click on a specific table (such as the Tabulated Data table) in the report and choose ‘Copy table’. Once it’s copied to your clipboard, switch to your word processor and paste it there.
You can take a table copied from the T.O.V.A. report and convert it into a table in Microsoft Word. Versions of Word vary, but here are instructions for some.
We try to support all printers, but if you encounter problems printing the T.O.V.A. report, there is a workaround:
We hope that this works for you. However, please do send us a Tech Support request (section 29) to let us know about the problem, so we can correct this for you and other users.
After that, you can automate this workaround:
From then on, printing a report will save a temporary file, open your default PDF viewer, and print the report using your default printer/settings.
 The T.O.V.A. Report
 Select pages and fields to include
 The Comparison Report
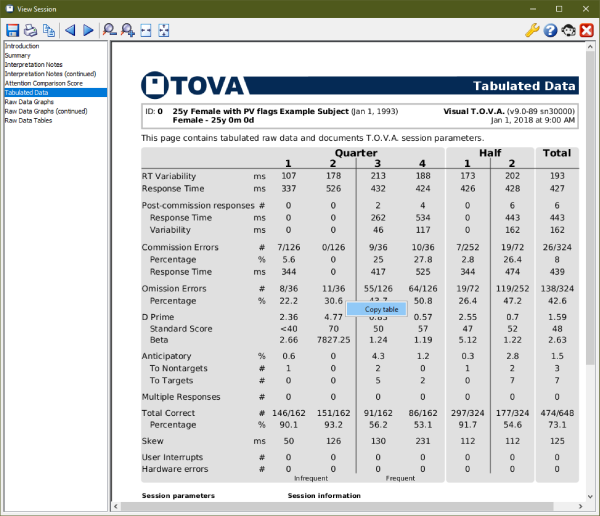 Copy just the table